Blindness detection with Artificial Intelligence
Imagine being able to detect blindness before it happened.
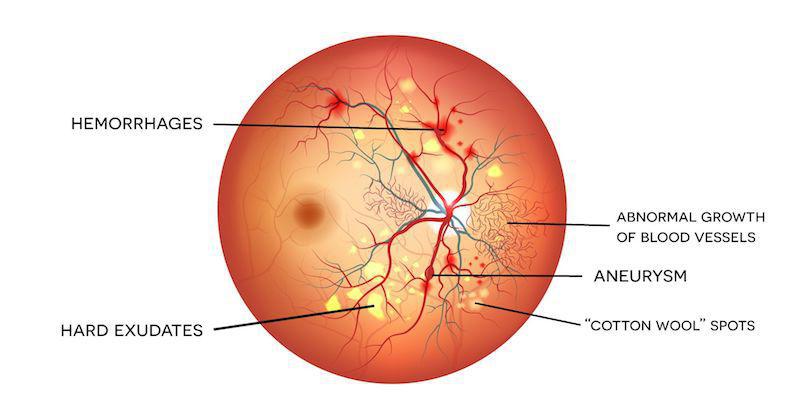
Millions of people suffer from Diabetic retinopathy (DR), the leading cause of blindness among working aged adults. Diabetic retinopathy is an eye disease associated with long-standing diabetes. This happens when high blood sugar levels cause damage to blood vessels in the retina. These blood vessels can swell and leak. Or they can close, stopping blood from passing through. Sometimes abnormal new blood vessels grow on the retina. All of these changes can steal your vision. You can follow this link to find more about it.
How can we help?
Currently detecting diabetic retinopathy is a time-consuming and manual process that requires a trained clinician to examine and evaluate digital color fundus photographs of retina. Expertise and equipment required to diagnose the disease often lacks in rural areas. As number of individuals with diabetes continues to grow, the infrastructure needed to prevent blindness due to DR will become even more insufficient.
Automation of DR screening can help us detect and prevent this disease among people living in rural areas, where medical screening is difficult to conduct. With color fundus photography as input, we need to detect whether eye has DR or not automatically. If there is DR, we can go even further and rate how severe the disease is in the eye.
In this blog post, I will show you how I trained a machine learning model to detect DR from retinal image of an eye automatically and also rate its severity. You can watch the following video, if you would like to see the step-by-step video demo:
Install machine learning tools
I used Intelec AI to train a diabetic retinopathy detector. You can download and install it from here for free.
Data
I used the data from the recent APTOS 2019 Blindness Detection challenge on Kaggle. It contains a large set of high-resolution retina images taken under a variety of imaging conditions. Clinicians had rated the presence of diabetic retinopathy in each image between 0 and 4, according to the following scale:
0 - No DR
1 - Mild
2 - Moderate
3 - Severe
4 - Proliferative DR
So I downloaded the dataset from the Data page of the competition, uploaded it to Intelec AI and extracted it.
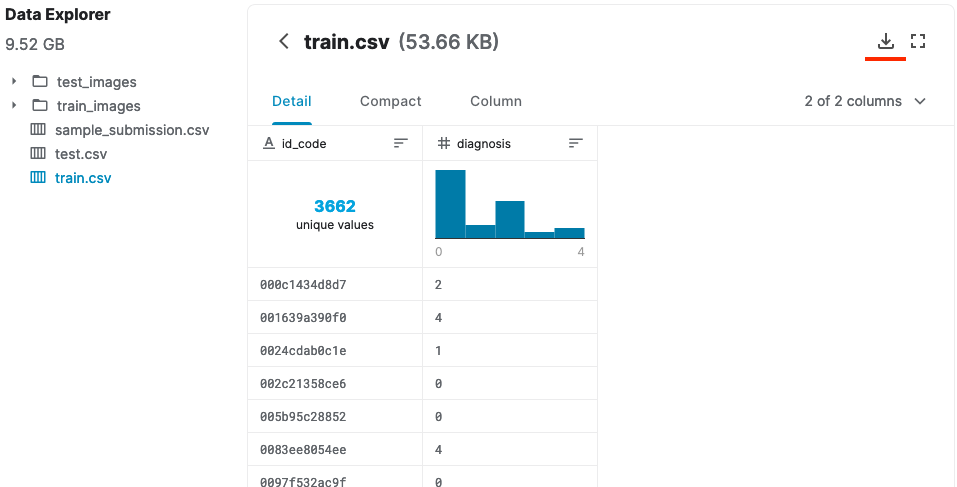
Let’s see what our dataset looked like:
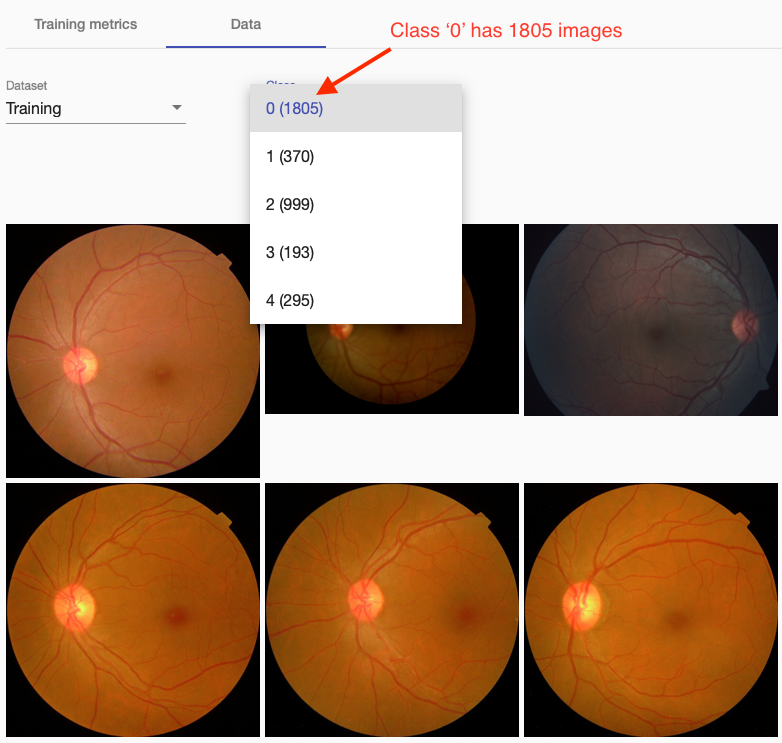
Above you see images of class ‘0’ (no DR). Retina seems clear without any visible artifacts. We can also see that different classes have different number of images; while class 0 has 1805 images, class 3 has only 193.
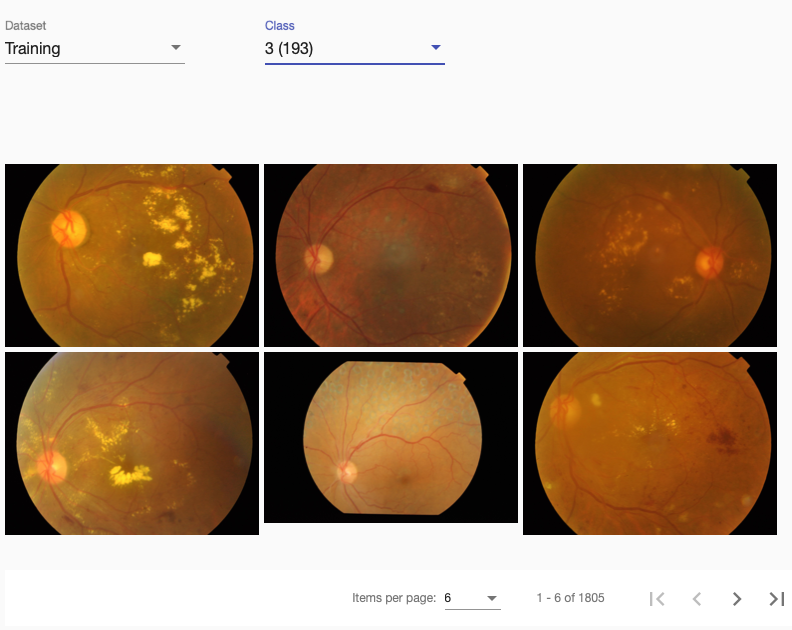
The following images are from class 3 (severe DR). There you can see many yellow spots (hard exudates) and some dark red spots near vessels (blood leaks).
Training first model
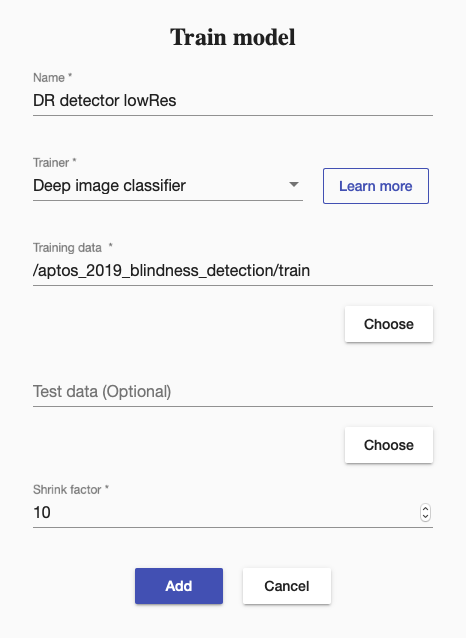
After the data exploration, I created a training using “Deep image classifier”. “Deep image classifier” is a big neural network, hence it can take some time to train it but it will achieve a good accuracy.
But there was a problem, images were big (average resolution 2100x1500), which, if used as given, might have slowed down our training significantly. I solved this problem by shrinking all images 10 times. Shrinking the training images can decrease accuracy of the final model but it is usually a good idea to start working on small images, before using the original images to get best accuracy.
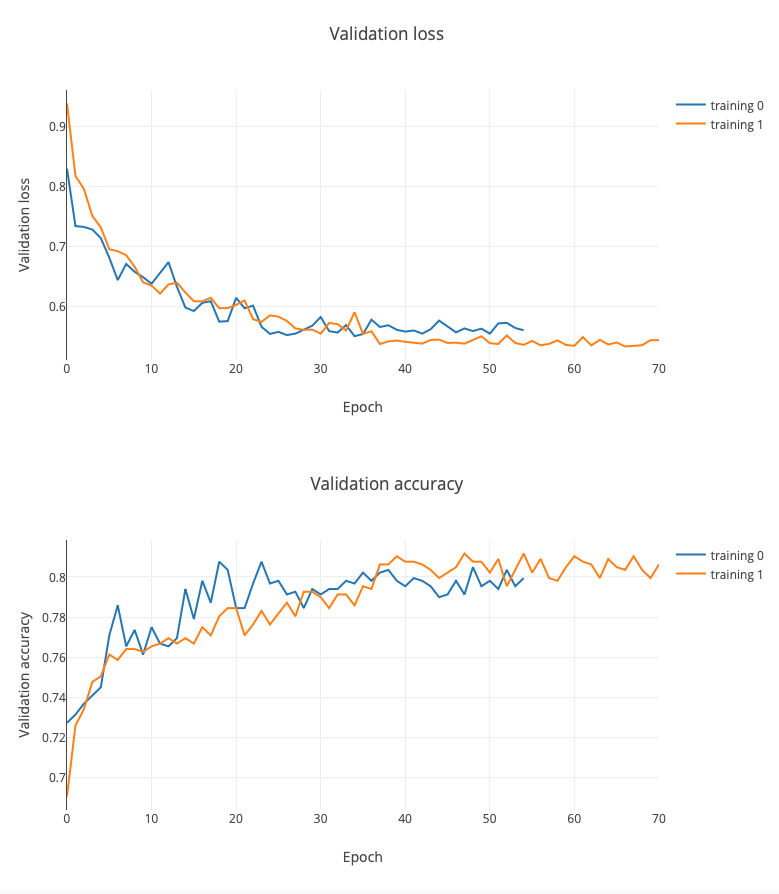
Then I started the training and waited until it finished. I could check the training progress live and see how the accuracy increased and the loss decreased.
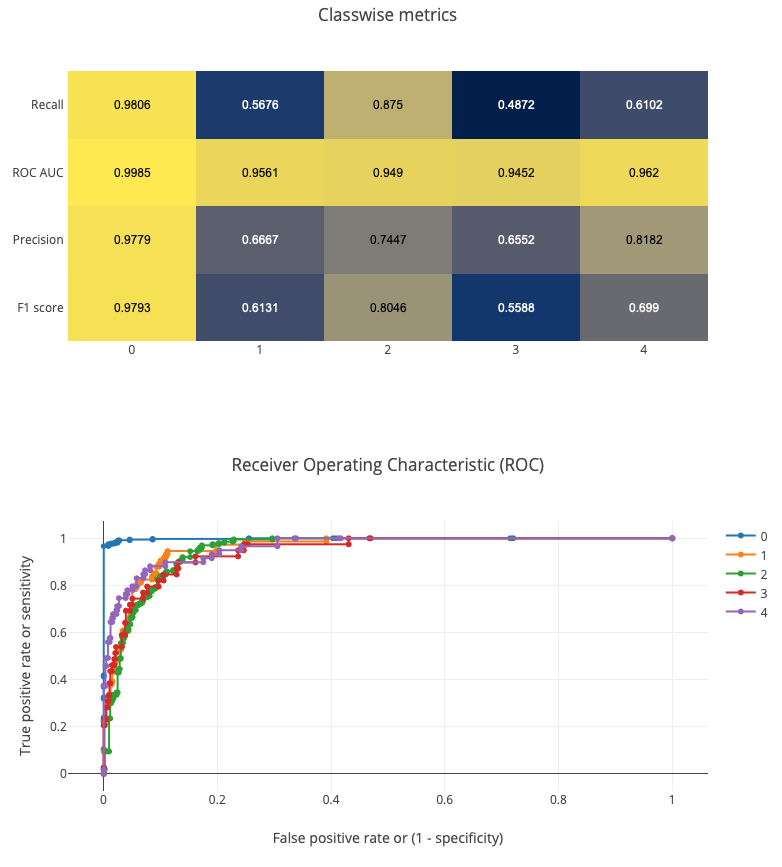
After the training finished, I checked the training summary to see the final statistics about the training and model performance.
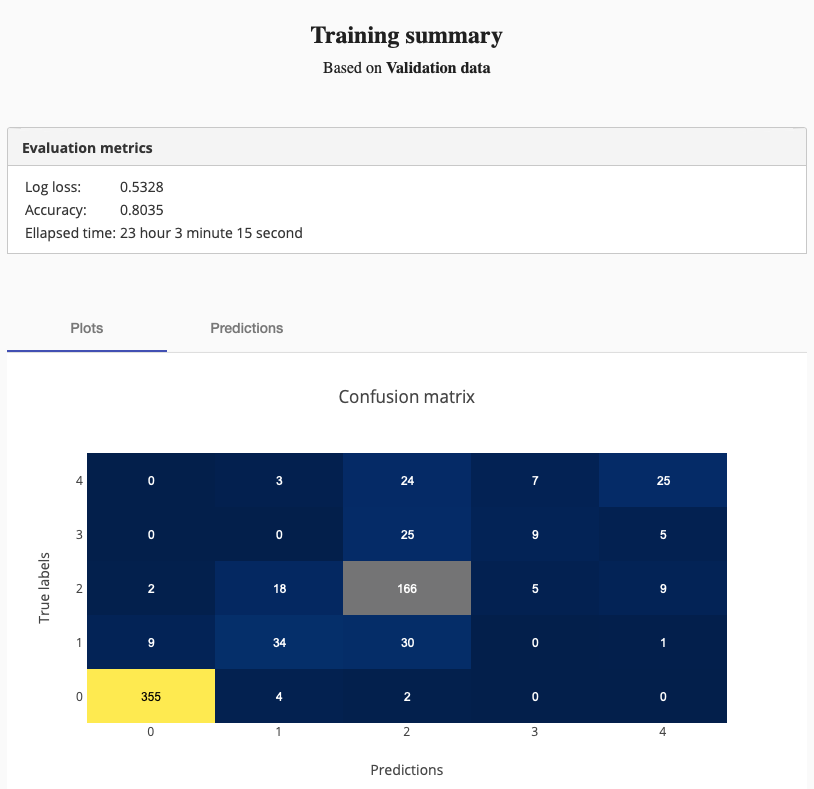
As you can see, the training ran 23 hours 3 minutes 15 seconds and achieved 80% accuracy.
Improving accuracy
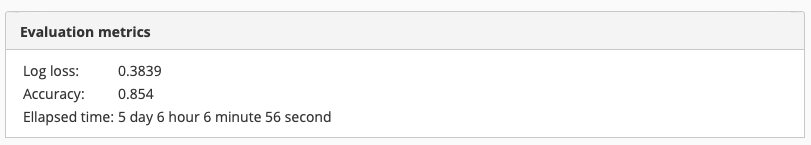
Could I do better? I knew that some of the artifacts in the images were tiny (for example, small blood leaks and yellow spots). They might have disappeared when I shrinked the images too much. So I hoped that if I shrunk the images less, I could restore some of the information, which I lost by shrinking the images 10 times. Hence I went ahead and decreased the shrink factor to 5, then I let the training run more. The result was as expected, it took more time for the training to finish but it achieved a higher accuracy.
Test final model
85.4% accuracy seemed good to me. So I deployed it to test how it works on the test images. One of the results from the test set looked like this:
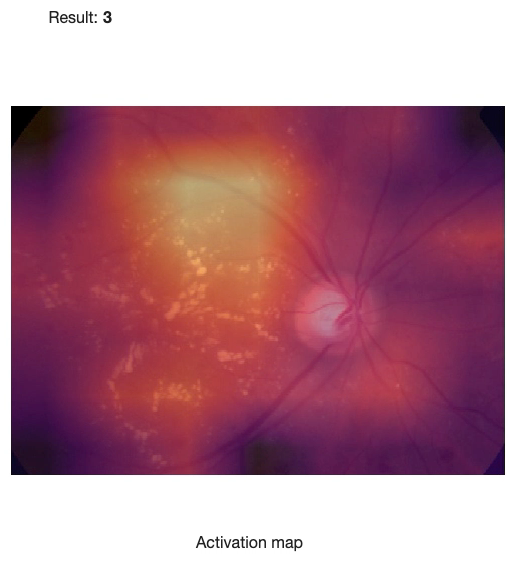 The above image was rated as class 3 (severe DR). You can also see the activation map, which shows which parts of the image the model gave more attention to while evaluating the severity of DR - the bright spots got more attention than the dark ones.
Summary
I was able to train a diabetic retinopathy detector, which achieved 85.4% accuracy. I also learned that increasing the image resolution can improve the model accuracy considerably if the spots of interest on the image are small.
That’s it from my side. I hope you found the blog post interesting and hopefully also learned something. Take care, until the next time.